Matplotlib
Matplotlib is a comprehensive library for creating static, animated,
and interactive visualizations in Python. Visualization is one of the best thing to check out result of code and
confirm that everything works as expected. We will be using visualization for testing and debug our code and matplolib
is great for that. It is simple and powerful tool that we will be using in this course, for example
to plot points in for Linear Regression or to plot Loss function or Reward achievements for RL agent and other examples.
You should be able to visualise similar graphics easily.
You should be able to visualise similar graphics easily.
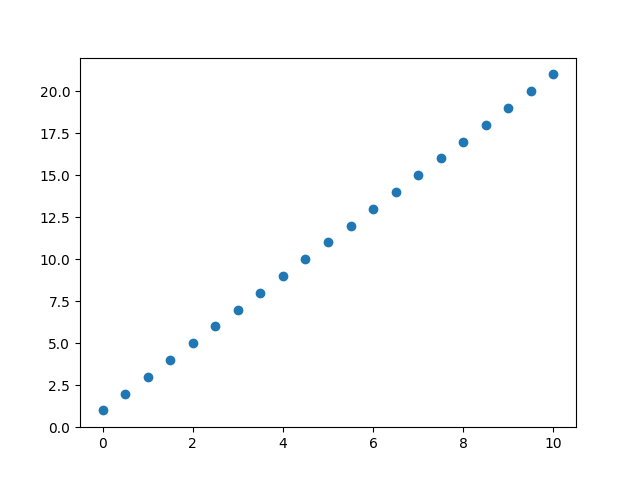
Example 1. Plot Points
# import libraries
import matplotlib
matplotlib.use('TkAgg')  # for mac
import matplotlib.pyplot as plt
import numpy as np

# prepare dataset/points to visualize
x = np.linspace(start=0,stop=10,num=21)
y = 2*x+1

# visualization part, adding elements to plot
plt.scatter(x,y)  # plot points
plt.title("y=2*x+1")
plt.ylabel("Y coordinate (meters)")
plt.xlabel("X (sec)")
plt.show()  # show image with all elemenents that we added

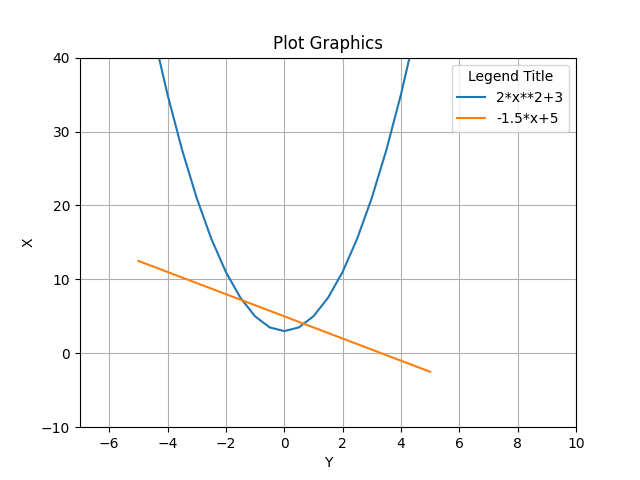
Example 2. Plot Graphics
x = np.linspace(start=-5,stop=5,num=21)
y = 2*x**2+3
y1 = -1.5*x+5

plt.plot(x,y,label="2*x**2+3")
plt.plot(x,y1,label="-1.5*x+5")
plt.title("Plot Graphics")
plt.ylabel("X")
plt.xlabel("Y")
plt.legend(title="Legend Title",loc='upper right')
plt.show()

Example 3. Plot graphic as animation inside for loop
This code will help you to visualize learning process of RL agent or other similar
requests.
For this you need to install IPython python package additionally.
from IPython import display
def plot(scores, mean_scores):
    display.clear_output(wait=True)
    display.display(plt.gcf())
    plt.clf()
    plt.title('Training...')
    plt.xlabel('Number of Games')
    plt.ylabel('Score')
    plt.plot(scores)
    plt.plot(mean_scores)
    plt.ylim(ymin=-2,ymax=10)
    plt.text(len(scores)-1, scores[-1], str(scores[-1]))
    plt.text(len(mean_scores)-1, mean_scores[-1], str(mean_scores[-1]))
    plt.show(block=False)
    # plt.savefig(f"images/{i}.png")
    plt.pause(.1)

scores = []
means = []
for i in range(100):
    scores.append(np.random.randint(0,10))
    means.append(np.mean(scores))
    plot(scores,means)

Create .gif from images
Code below is useful to create gif from images. These helped me a lot for many reports in my jobs so, this snippet must be here! P.S gif above is created with this code. and we will use it often in the future.
from PIL import Image
import glob


def get_step(a):

    return int(a.split("/")[1].split(".")[0])


def create_gif_from_pngs(input_directory:str,output_directory:str)->None:
    """
    input_directory:str name of folder with images
    output_directory: str name of folder to save .gif
    """

    frames = []

    imgs = glob.glob(f"{input_directory}/*.png")
    for i in sorted(imgs, key=get_step):
        new_frame = Image.open(i)
        frames.append(new_frame)
        print(i)

    frames[0].save(f"{output_directory}/steps.gif", format="GIF",
                   append_images=frames[1:],
                   save_all=True,
                   duration=300, Loop=0)


if __name__ == '__main__':
    create_gif_from_pngs("images", "images")